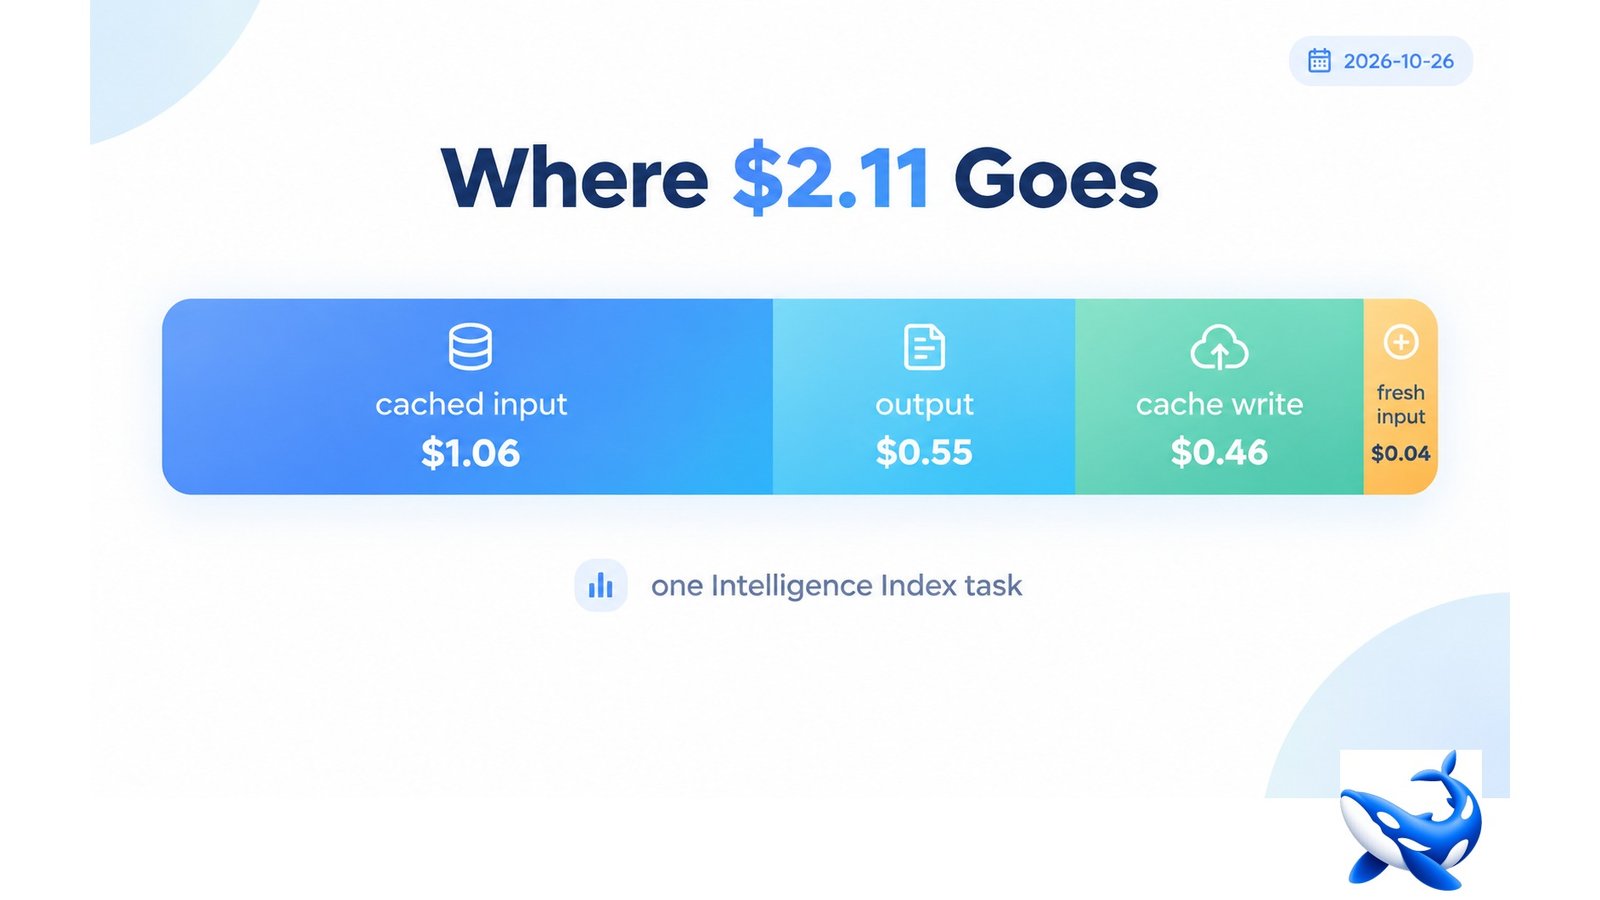

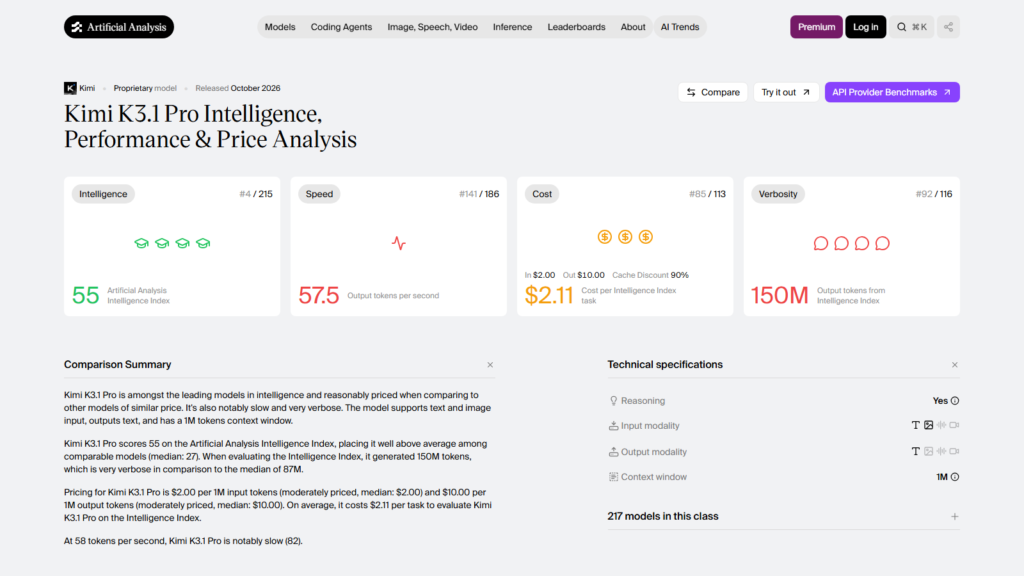
Ask what Kimi K3.1 Pro costs and you get $2.00 per million in, $10.00 out, $0.20 cached. Ask what a *task* costs and the answer is $2.11, of which $1.06 is cached input, $0.55 is output, $0.46 is cache writes and $0.04 is fresh input [INDEPENDENT — Artificial Analysis, index v4.3.2, read 26 October]. Cached reads carry half the bill. The output line everyone quotes carries a quarter. OrcaRouter passes the Kimi K3.1 Pro API rates through at list with no markup, which means the decomposition below applies unchanged to traffic on our route.
This is the article to read before you build a cost model from a rate card. The rate card tells you the price of a token. It does not tell you the mix of tokens a workload buys, and for this model the mix is nothing like the one the rates suggest.
What a task actually consumes
Divide the evaluator’s canonical run by its task count and you get a shape that will surprise anyone who models this model from its output price:
| Per Intelligence Index task | Value |
| Input tokens read | ~2,010,000 |
| — of which cached | ~1,900,000 |
| — of which cache writes | ~105,000 |
| — of which fresh | ~11,000 |
| Output tokens written | 55,195 |
| — of which reasoning | 34,883 (63%) |
| — of which answer | 20,312 (37%) |
| Time | 845.6 s |
| Cost | $2.11 |
Two million tokens read for fifty-five thousand written. An input-to-output ratio of 36 to 1. At $2.00 and $10.00 the intuition says output costs five times as much per token, so a 36:1 ratio should make input the smaller line. It does the opposite, because 95% of that input is billed at $0.20 — a tenth of the input rate — and because output is only 55K tokens.
The exact split, in dollars:
| Line | Cost per task | Share |
| Cached input reads | $1.0565 | 50% |
| Output (reasoning + answer) | $0.5519 | 26% |
| Cache writes | $0.4622 | 22% |
| Non-cached input | $0.0438 | 2% |
| Total | $2.1145 | 100% |
Why there is so much cached input
Kimi K3.1 Pro is a long-context agentic model. Its work pattern — the one both independent evaluators observe — is many turns over the same large context: read the repository, plan, act, re-read, act again. Every turn re-sends the conversation, and every re-send is a prefix the cache has already seen.
Moonshot’s platform caches automatically for repeated request prefixes, with a five-minute TTL by default, and bills the read at $0.20 against a $2.00 write rate [VENDOR]. A burst of turns inside five minutes re-reads at a tenth of the input price. The same pattern is visible in the data analytics benchmark: about 440,000 input tokens per question, 92% of them cache hits [INDEPENDENT — Plotly].
So the cache is not an optimisation you add. It is the default state of this model’s traffic, and it is why the effective input price is closer to twenty-one cents than two dollars.
See also: Can Stolen Cryptocurrency Be Recovered?
The bill you can control
Three levers, in descending order of effect.
The cache-write line. $0.46 of every $2.11 — 22% — is writing new prefixes into the cache. Writes happen when the context changes at the front, which happens whenever you change a system prompt, a tool schema, an effort setting, or the order of your documents. A stable prefix written once is cheap; a prefix rewritten every turn is a quarter of your bill. If you are getting a worse cost profile than the table above, look here first.
The five-minute TTL. The default cache lifetime is five minutes. Traffic that arrives in bursts inside that window reads at a tenth; traffic that arrives spread over an hour pays writes repeatedly. Batching requests so that a burst shares one prefix is the single highest-leverage change available on a workload that is otherwise identical. Moonshot also sells a one-hour TTL write at $4.00 per million [VENDOR] — twice the five-minute write price, and worth it only when your inter-request gap is consistently longer than five minutes and shorter than an hour.
Effort. `reasoning_effort` accepts `low`, `high` and `max` with max as the default [VENDOR]. Effort drives the reasoning half of the output line, and output is 26% of the bill. But be careful with the interaction: changing effort mid-conversation changes the prompt, which invalidates the cached prefix, which moves cost from the $0.20 line to the $2.00 line. A tuning loop that flips effort on every request is the most expensive way to use this model.
What this decomposition implies for routing
The number to compare across models is not the rate card, it is cost per task at your token mix. Two models at $2/$10 can differ by 40% on that metric if one reads 2M tokens per task and the other reads 400K.
That is exactly what the data-analytics test found in the other direction: Kimi K3.1 Pro at 98% accuracy cost $0.31 per question against a competitor’s $0.06 at 100% — same ballpark on rates, five times apart on bill — because the models made different numbers of tool calls [INDEPENDENT — Plotly]. Nothing on a rate card predicts that.
A routing decision follows directly. Long-context, multi-turn, cache-friendly work — repository agents, document analysis, structured extraction over a big corpus — is where this model’s token mix is a feature: the 36:1 read-to-write ratio is what you want, and the cache line keeps it affordable. Short, single-turn, high-volume classification is where it is a liability: two million tokens of context per task cannot be amortised over a one-line answer.
Measuring your own
Four numbers, and every provider exposes them in usage metadata: input tokens, cached input tokens, cache write tokens, output tokens. Pull them for a week of real traffic, multiply by the rate card, and compare the result with what you expected from a per-token estimate. If the difference is large, it is almost always the cache-write line, and the fix is prompt stability rather than a cheaper model.
The summary is a single sentence: on Kimi K3.1 Pro, the meter that runs is the cached read at $0.20, the line you can most easily waste is the cache write at $2.00, and the $10.00 output price — the one in the headline — accounts for a quarter of a real task.
Sourcing note: the per-task dollar decomposition, the input/output token counts, the reasoning share and the 845.6-second task time are Artificial Analysis measurements on index v4.3.2, read 26 October 2026. The 92%-cached, 440K-input figure and the $0.31-per-question comparison are Plotly’s single-run private benchmark. Cache TTL, the five-minute and one-hour write rates, and the effort options with max as default are Moonshot’s documentation. Our catalogue carries Moonshot’s standard SKU at list price with no markup.